Bitcoin has seen a significant outflow from exchanges, recording the largest withdrawal of the digital asset from centralized trading networks since November 2022. On-chain data shows that this pattern is continuing through 2023 and in 2024 as well, with many users moving their assets away from exchanges.
This movement is visible in the 30-, 50-, and 100-day moving averages, all of which show an increase in withdrawals.
Historical Patterns Show Price Correlation
Historically, large Bitcoin transactions from exchanges have coincided with upward price movements. This trend has held since late 2022 when Bitcoin’s price began to recover, showing positive momentum as investors moved their assets off exchanges.
Traders and market analysts have taken notice, with many interpreting such outflows as a sign of investor confidence and a potential signal of future price increases.
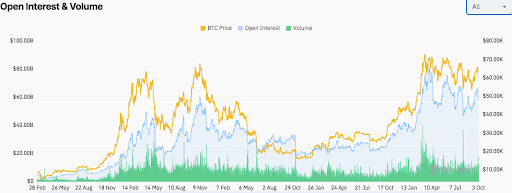
Furthermore, Bitcoin’s market activity over the past year has shown a strong correlation between its price movements, open interest, and trading volume. Major gains in Bitcoin’s price occurred in mid-November and April when prices surged above $60,000.

Source: Coinglass
During periods of price decline, such as in May and July, trading volume fell while open interest remained stable.
Market Activity and Price Fluctuations
Currently, Bitcoin is trading at $61,178.77, down 0.32%. However, the trading volume remains at $34.8 billion, with a total market cap of $1.21 trillion over the last day.
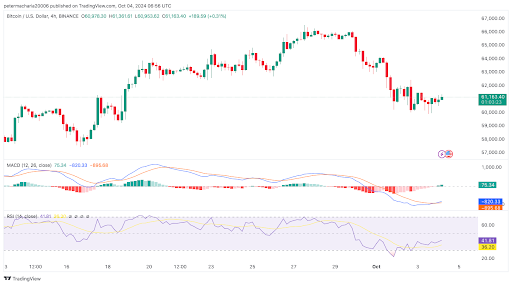
Looking at the technical analysis, Bitcoin’s price chart, viewed on a 4-hour timeframe, shows Bitcoin trading around $61,163.40. After a sudden drop from $66,000 to $60,000, the price is stabilizing, supported by upward momentum.
The MACD indicator shows signs of a potential bullish crossover, suggesting that the recent bearish momentum could weaken.

Source: TradingView
Additionally, the RSI sits at 41.81, which suggests the market is nearing oversold conditions.
Disclaimer: The information presented in this article is for informational and educational purposes only. The article does not constitute financial advice or advice of any kind. Coin Edition is not responsible for any losses incurred as a result of the utilization of content, products, or services mentioned. Readers are advised to exercise caution before taking any action related to the company.


