Bitcoin price dived 4% during Thursday’s U.S. market session, currently trading at $95,400. The downtick signals renewed selling pressure in the crypto market and the potential continuation of the correction trend. As the coin price is yet to show a stable bottom support for reversal, several renowned analysts predict a downfall to $70,000 is possible.
According to CoinGecko Data, the BTC market cap currently stands at $1.89 Trillion, while the 24-hour trading volume is at $44.7 Billion.
Key Highlights:
- Crypto analysts predict a prolonged correction for Bitcoin price, likely to $70,000 levels.
- The current correction could seek support at the $85,800 and $79,000 levels.
- The coin price trading above 50% Fibonacci retracement level indicates the buyers remain dominant players in the market.
Crypto Analysts Signal Bearish Momentum for BTC
In a recent tweet, veteran trader Peter Brandt highlights the formation of a broadening triangle pattern in BTC’s daily bar chart. Theoretically, the diverging nature of the two trendlines indicates increasing uncertainty, which leads to a bearish breakdown.
If this happens, the analyst predicts the current correction could enter the $70,000 range.

Bitcoin Analysis| Peter Brandt
Another renowned trader, Tone Vays, believes the Bitcoin price trading below the $95,000 level is “very, very bad” as it increases the probability of a correction to $73,000.
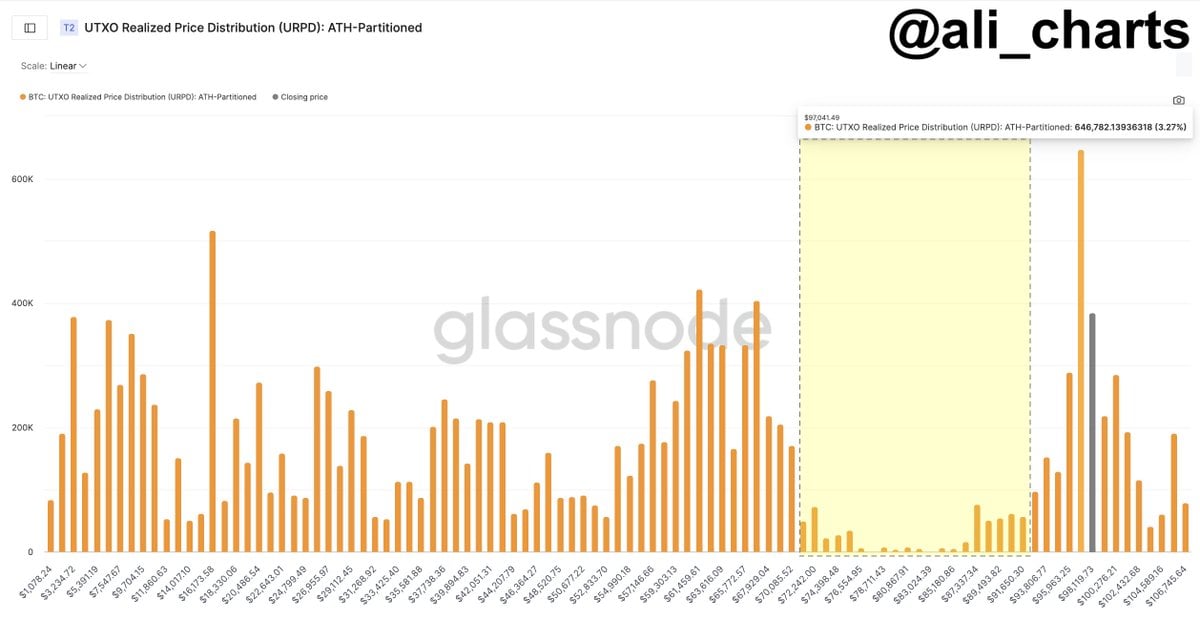
Furthermore, crypto analyst Ali Martinez signals that the key support for BTC is around $97,041 and $93,806. If the price breaks below this floor, the UTXO Realized Price Distribution chart shows the next major support lies at $70,085.

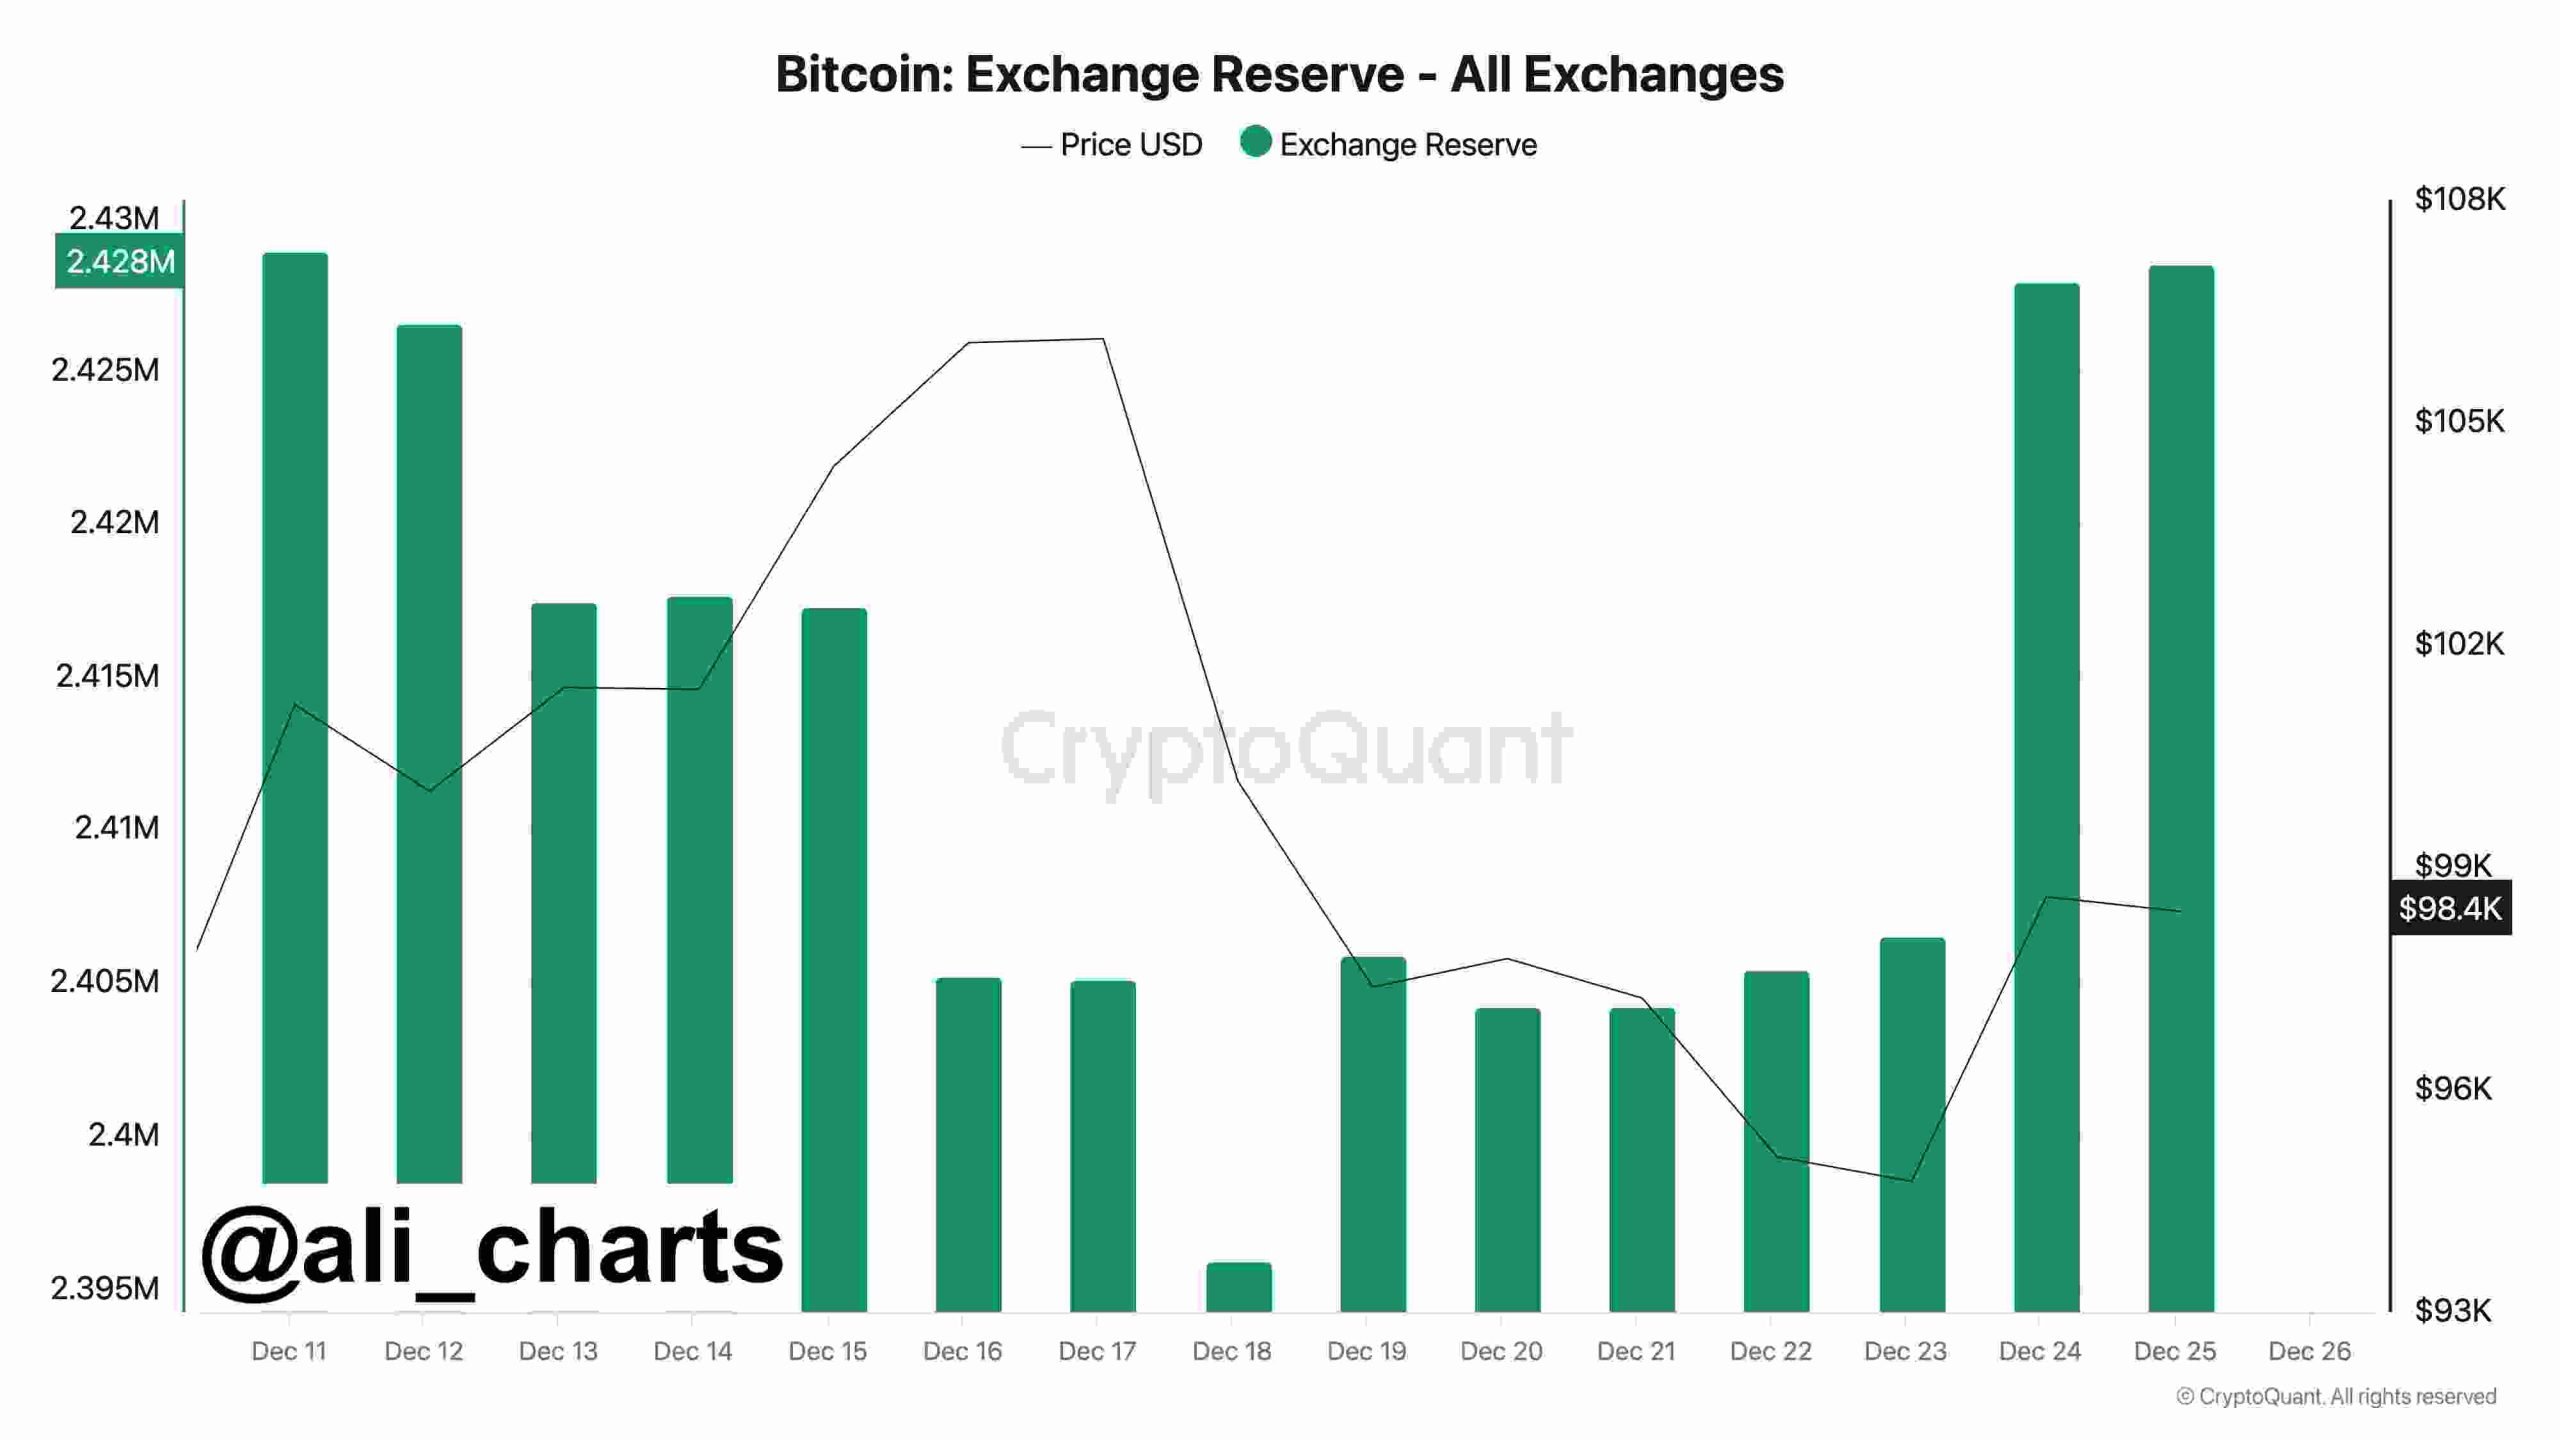
Ali charts also highlighted that over 33,000 BTC ( worth around $3.2 Billion) has been set to exchanges since last week. This inflow to exchanges generally indicates potential selling that could accelerate the bearish momentum.

Bitcoin Price Drop Highlights Key FIB Levels
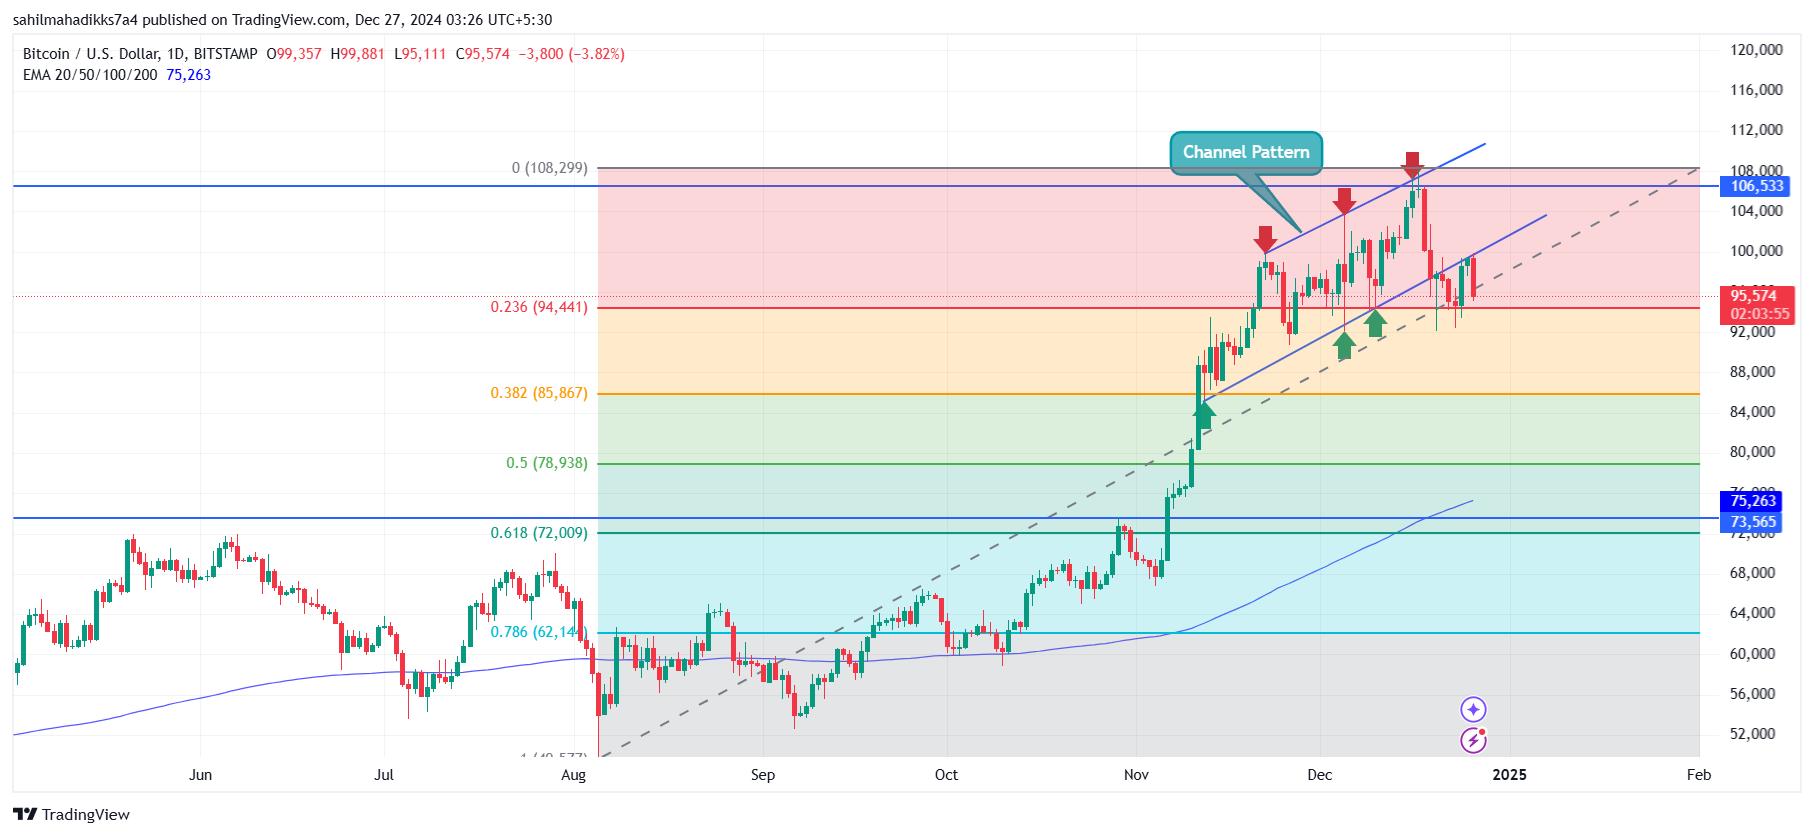
In the last two weeks, the Bitcoin price plunged from $108,365 to $95,111, registering a loss of 12.3%. The correction trend shows a breakdown below the support of the rising channel pattern, offering sellers firm resistance to bolster further downfall.
A 4% drop today shows the asset’s suitability below $100k, which could drive a prolonged correction to $85,800, followed by $79,000.

BTC/USD -1d Chart
However, the aforementioned level coinciding with 38.2% and 50% FIB indicates the broader market trend is bullish, and buyers could renew exhausted bullish momentum.


