Ethereum’s price has been trending lower over the past couple of months and is yet to show a sign of recovery.
In the past 24 hours alone, ETH dropped to a monthly low of just over $2,300.
Technical Analysis
By Edris Derakhshi
The Daily Chart
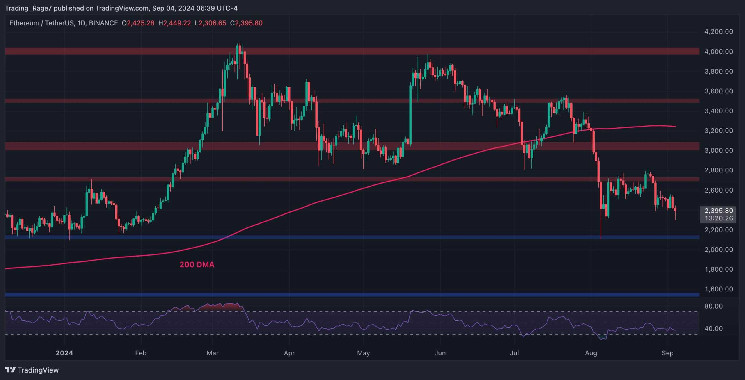
In the daily timeframe, the price has been dropping since the breakdown of the 200-day moving average, which is located around the $3,200 mark. The Relative Strength Index also demonstrates values below 50%, indicating that the momentum is clearly bearish.
As a result, the most probable scenario in the short term is for the market to drop toward the $2,100 support zone. Overall, as long as ETH is trading below its 200-day moving average, the market trend can be considered bearish.
The 4-Hour Chart
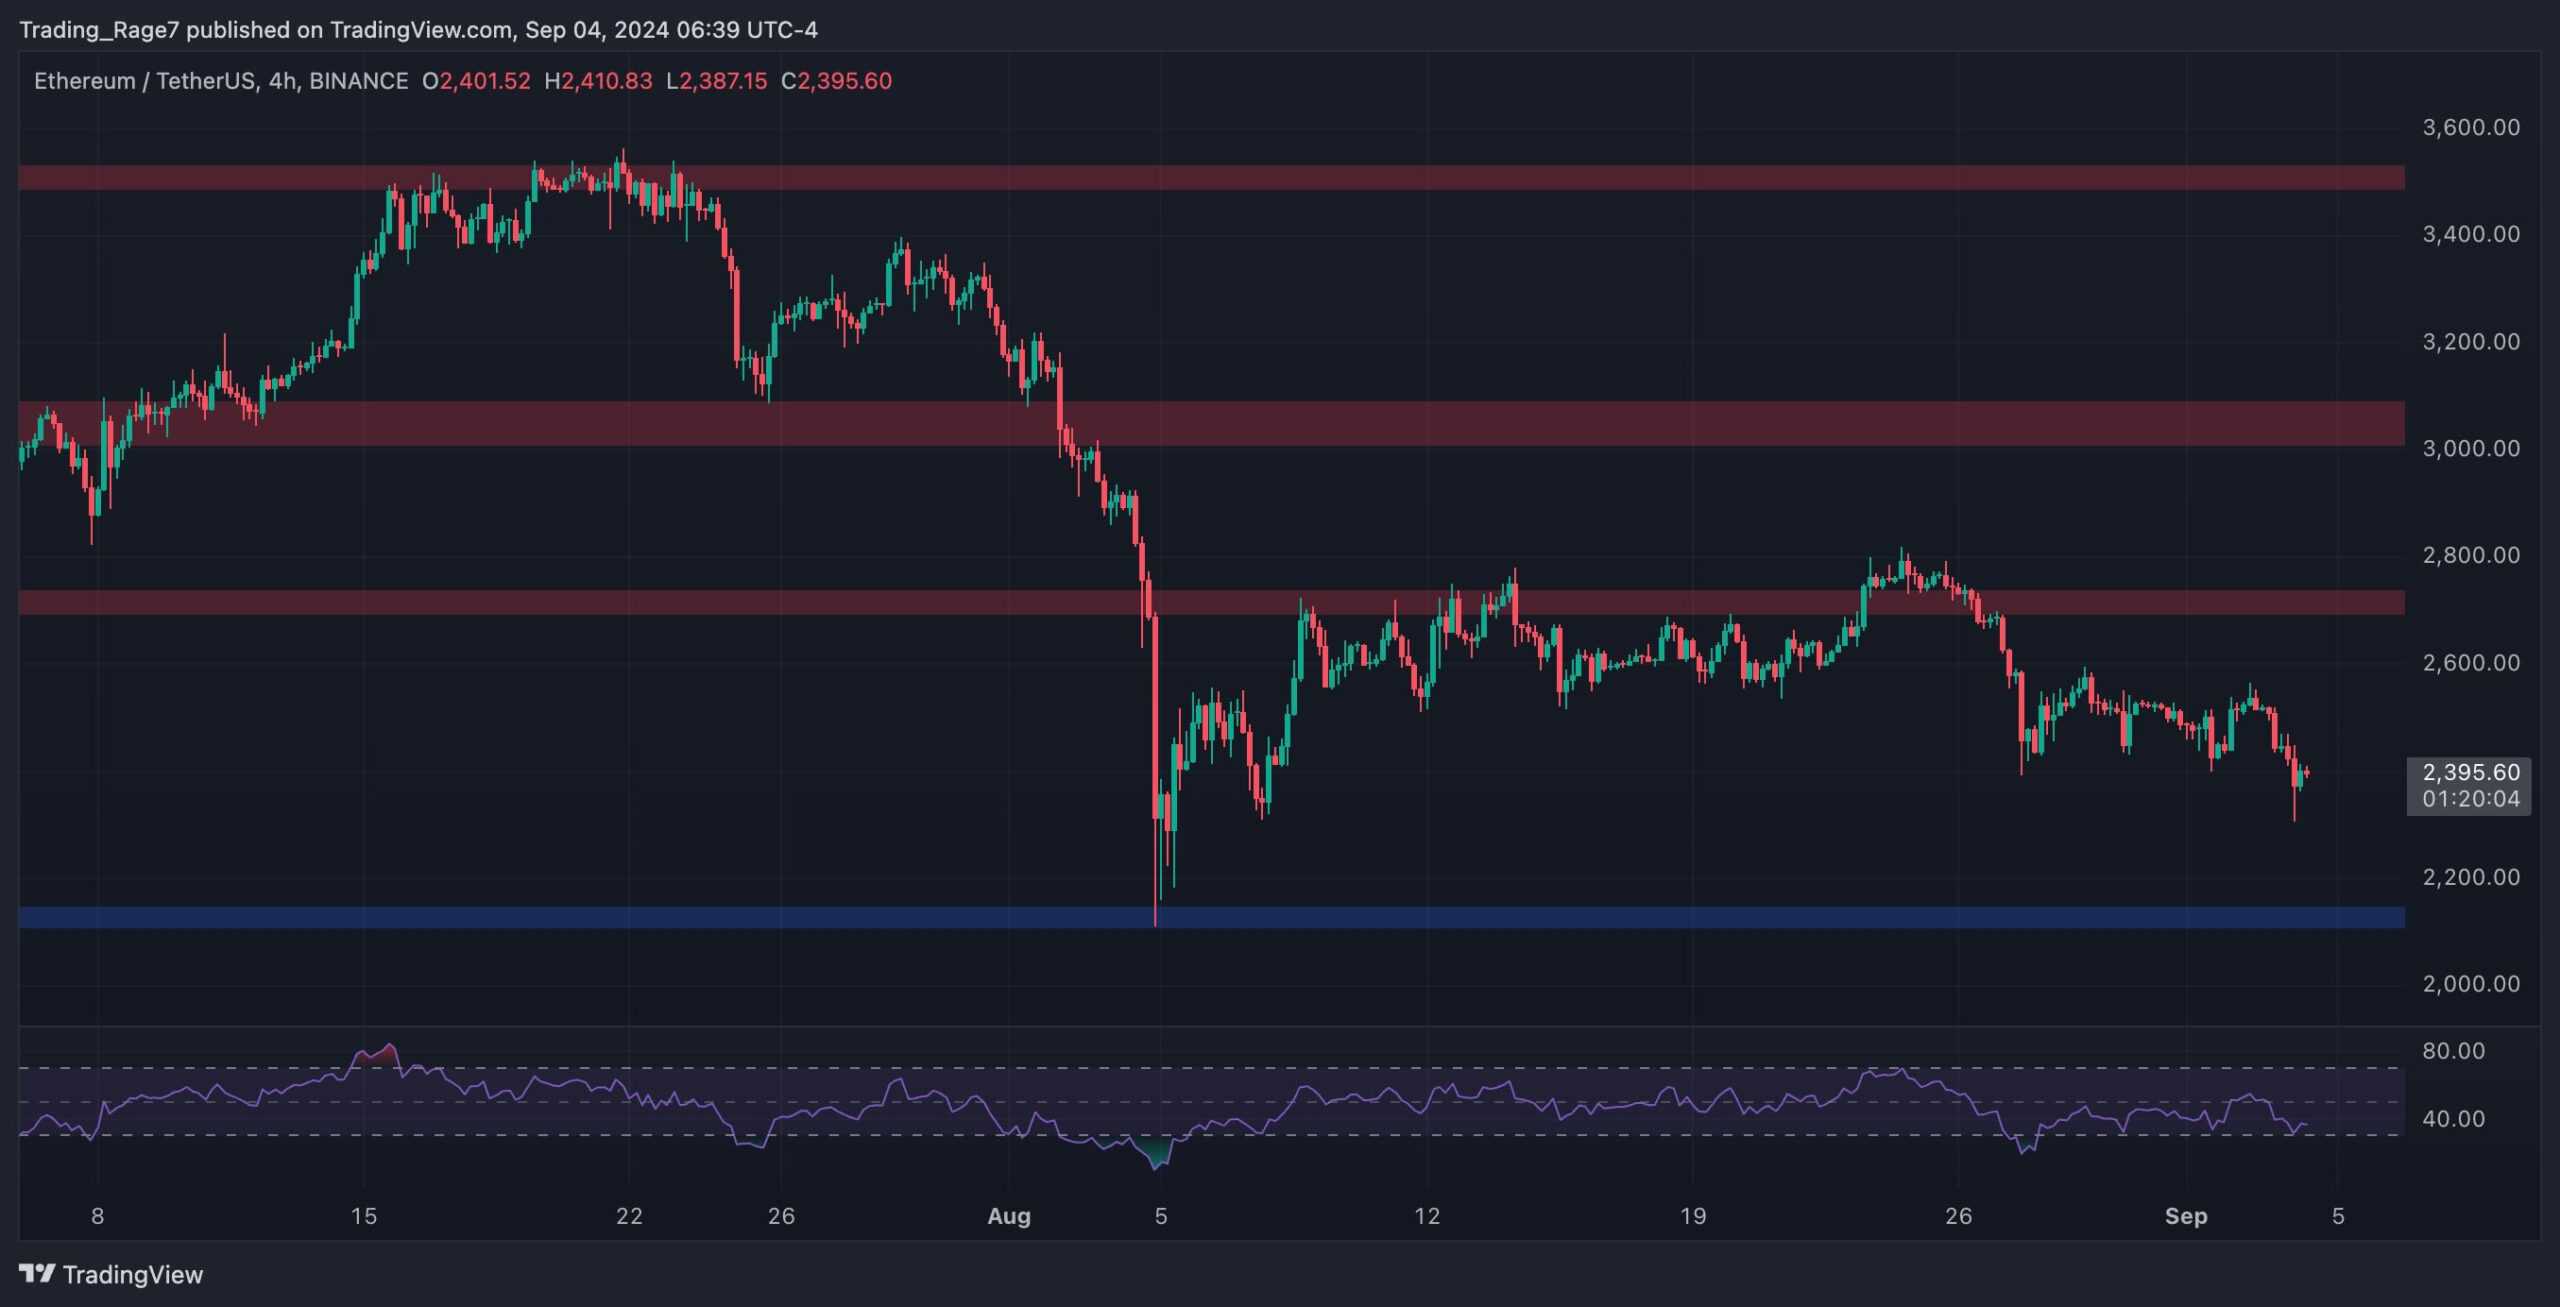
The 4-hour chart of the ETH/USDT pair shows a clearer picture of the recent downtrend. After the price lost the $3,000 and the $2,700 support zones, it has been consolidated above the $2,100 level.
Over the recent days, however, the asset has retested the $2,700 level once more, but it has been rejected to the downside. Considering the fact that the market is now creating lower highs and lows, a drop back toward the $2,100 level seems highly probable in the upcoming days.
Sentiment Analysis
By Edris Derakhshi
Ethereum Funding Rates
With the perpetual futures market having a significant influence on the short-term price action of the crypto market, analyzing the aggregate sentiment of futures traders might give some clues about the future direction.
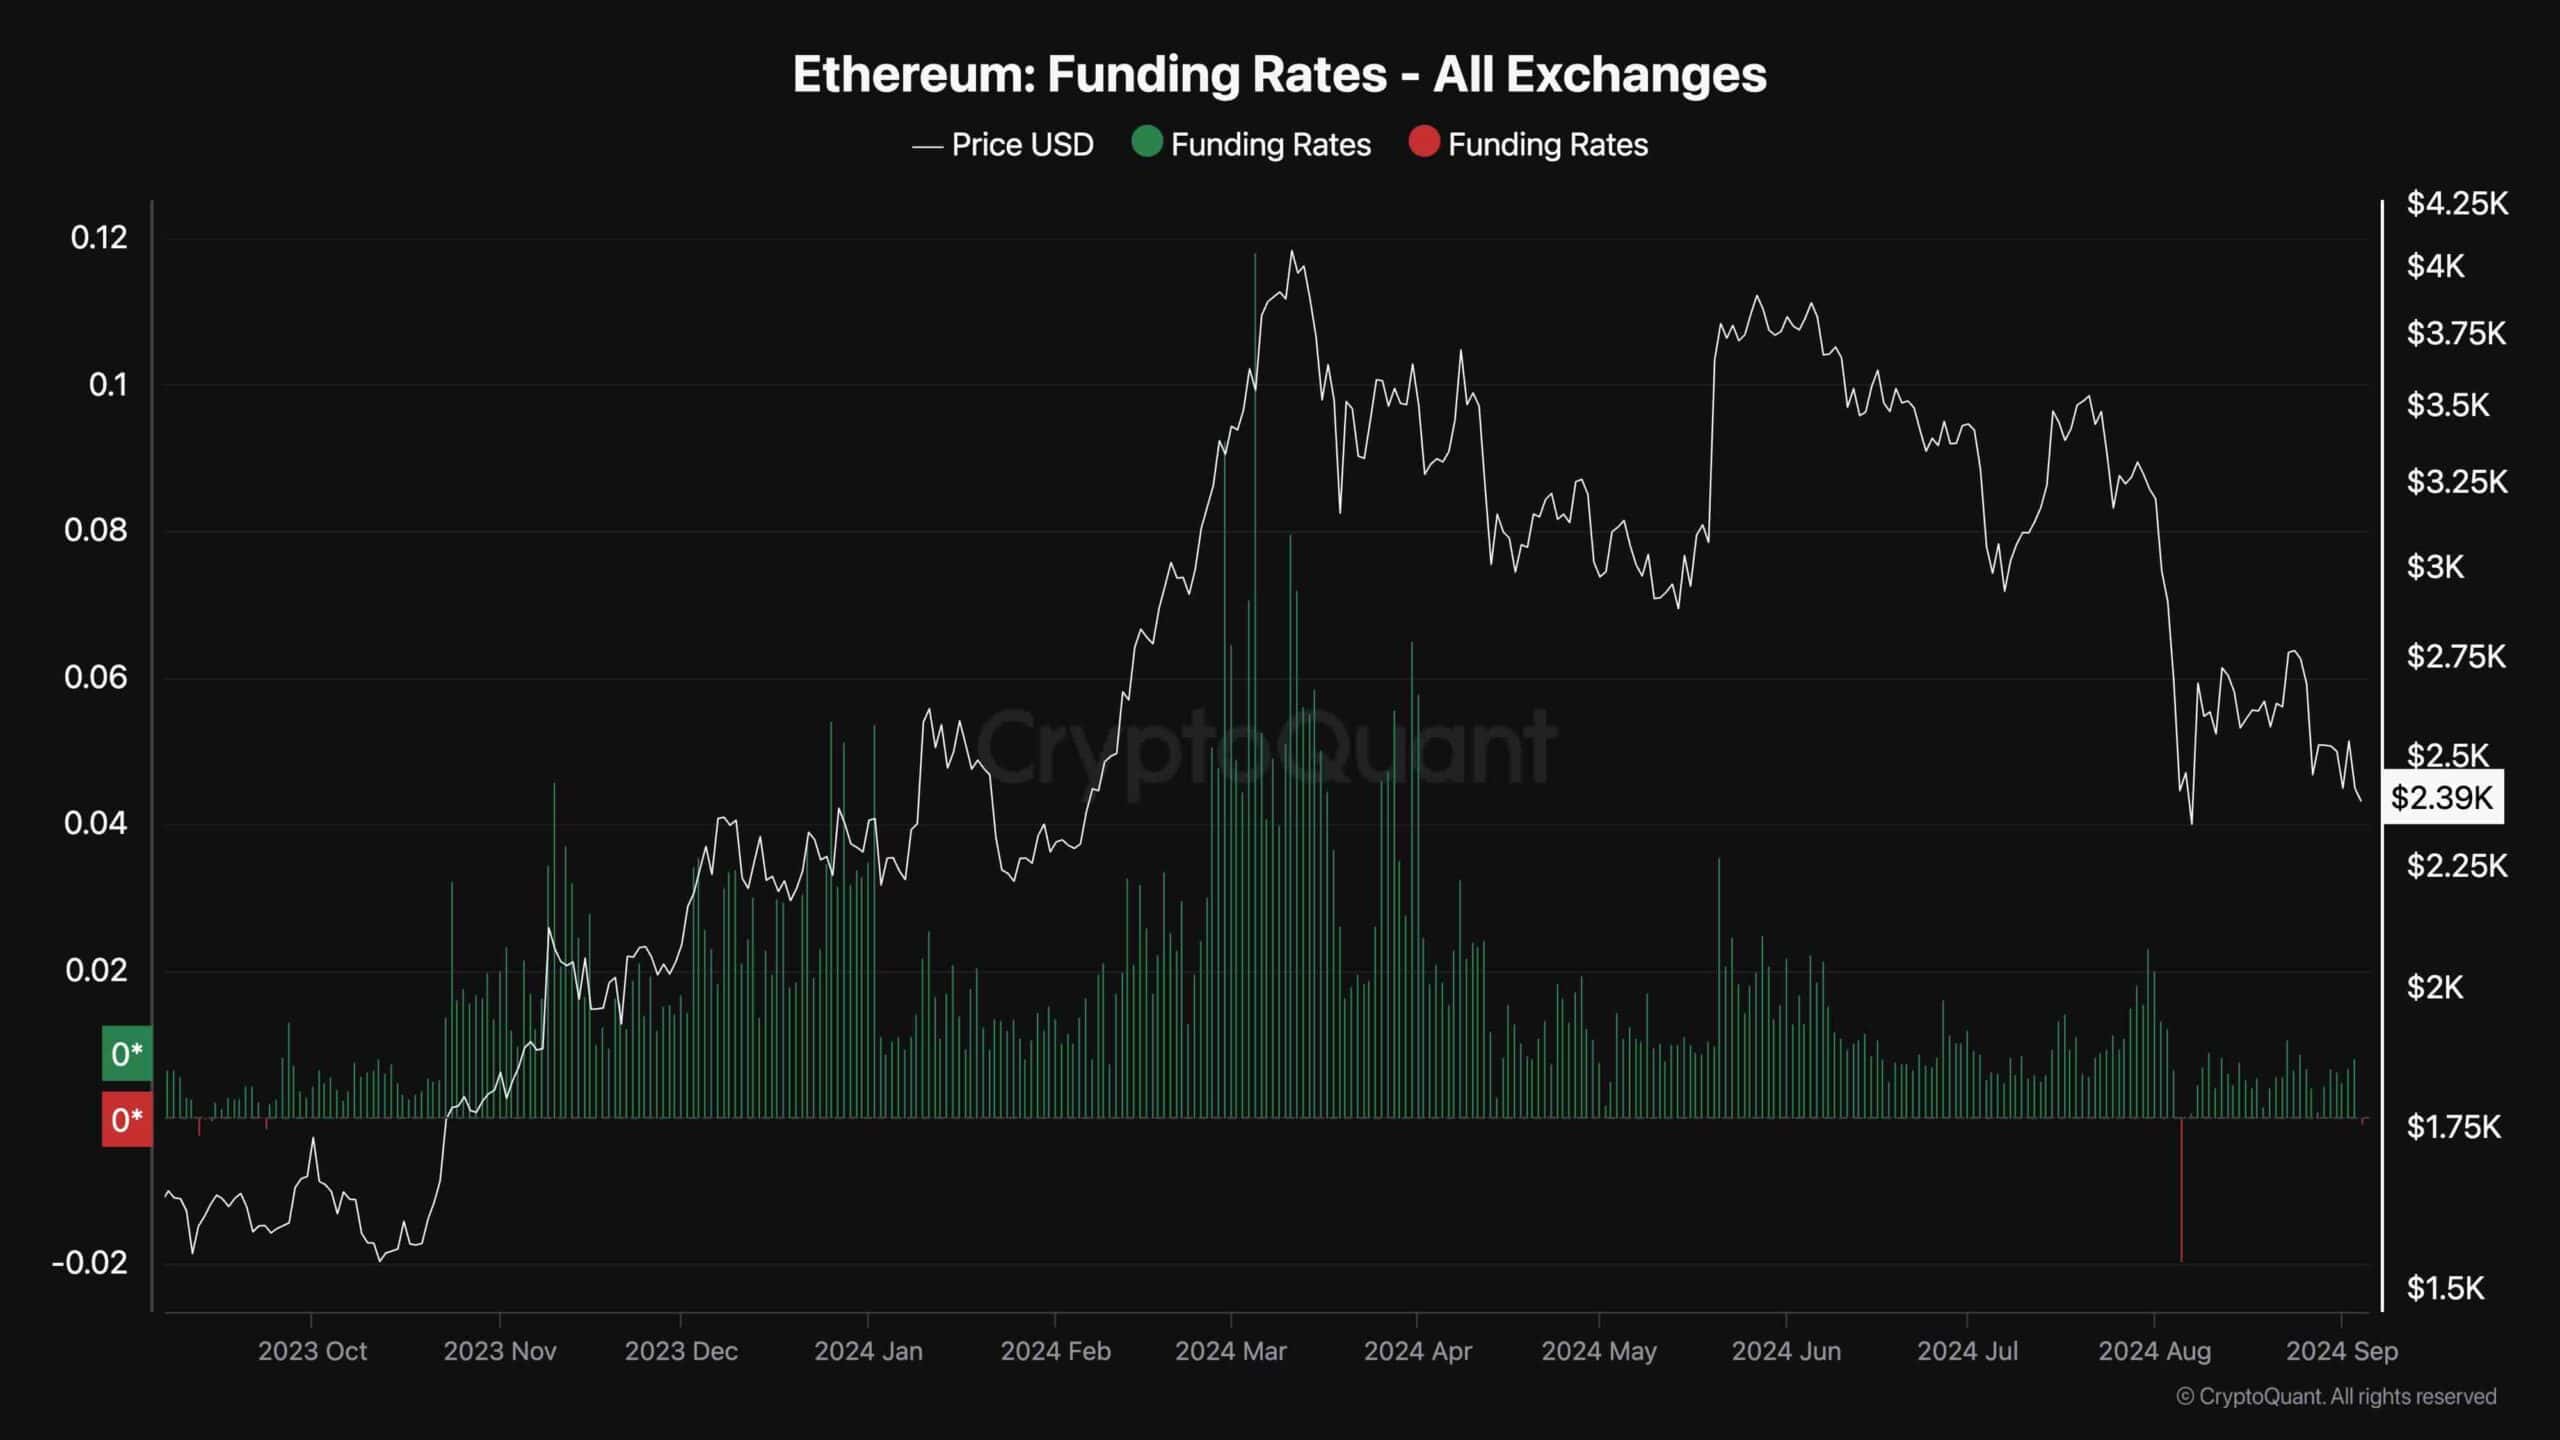
This chart displays the ETH funding rates, visualizing whether the buyers or sellers are executing their orders more aggressively (using market orders) in the futures market.
As the chart suggests, the funding rates have again dropped below zero, which is a clear sign of bearish sentiment. Yet, while not always a good sign, negative funding rates are usually one of the initial signs of market recovery, as they might lead to short liquidation cascades. However, this highly depends on whether sufficient spot buying pressure is present.


