The Donald Trump-linked meme coin MAGA (TRUMP) has experienced a sharp decline over the past week. This diverges from the broader market rally sparked by Trump’s victory in the 2024 US presidential elections. TRUMP trades at $1.48 as of this writing, marking a 35% drop in the past seven days.
With plunging buying pressure, the meme coin is on track to retest its year-to-date low. The question now is how soon TRUMP will breach this level.
MAGA Traders Continue To Dump Holdings
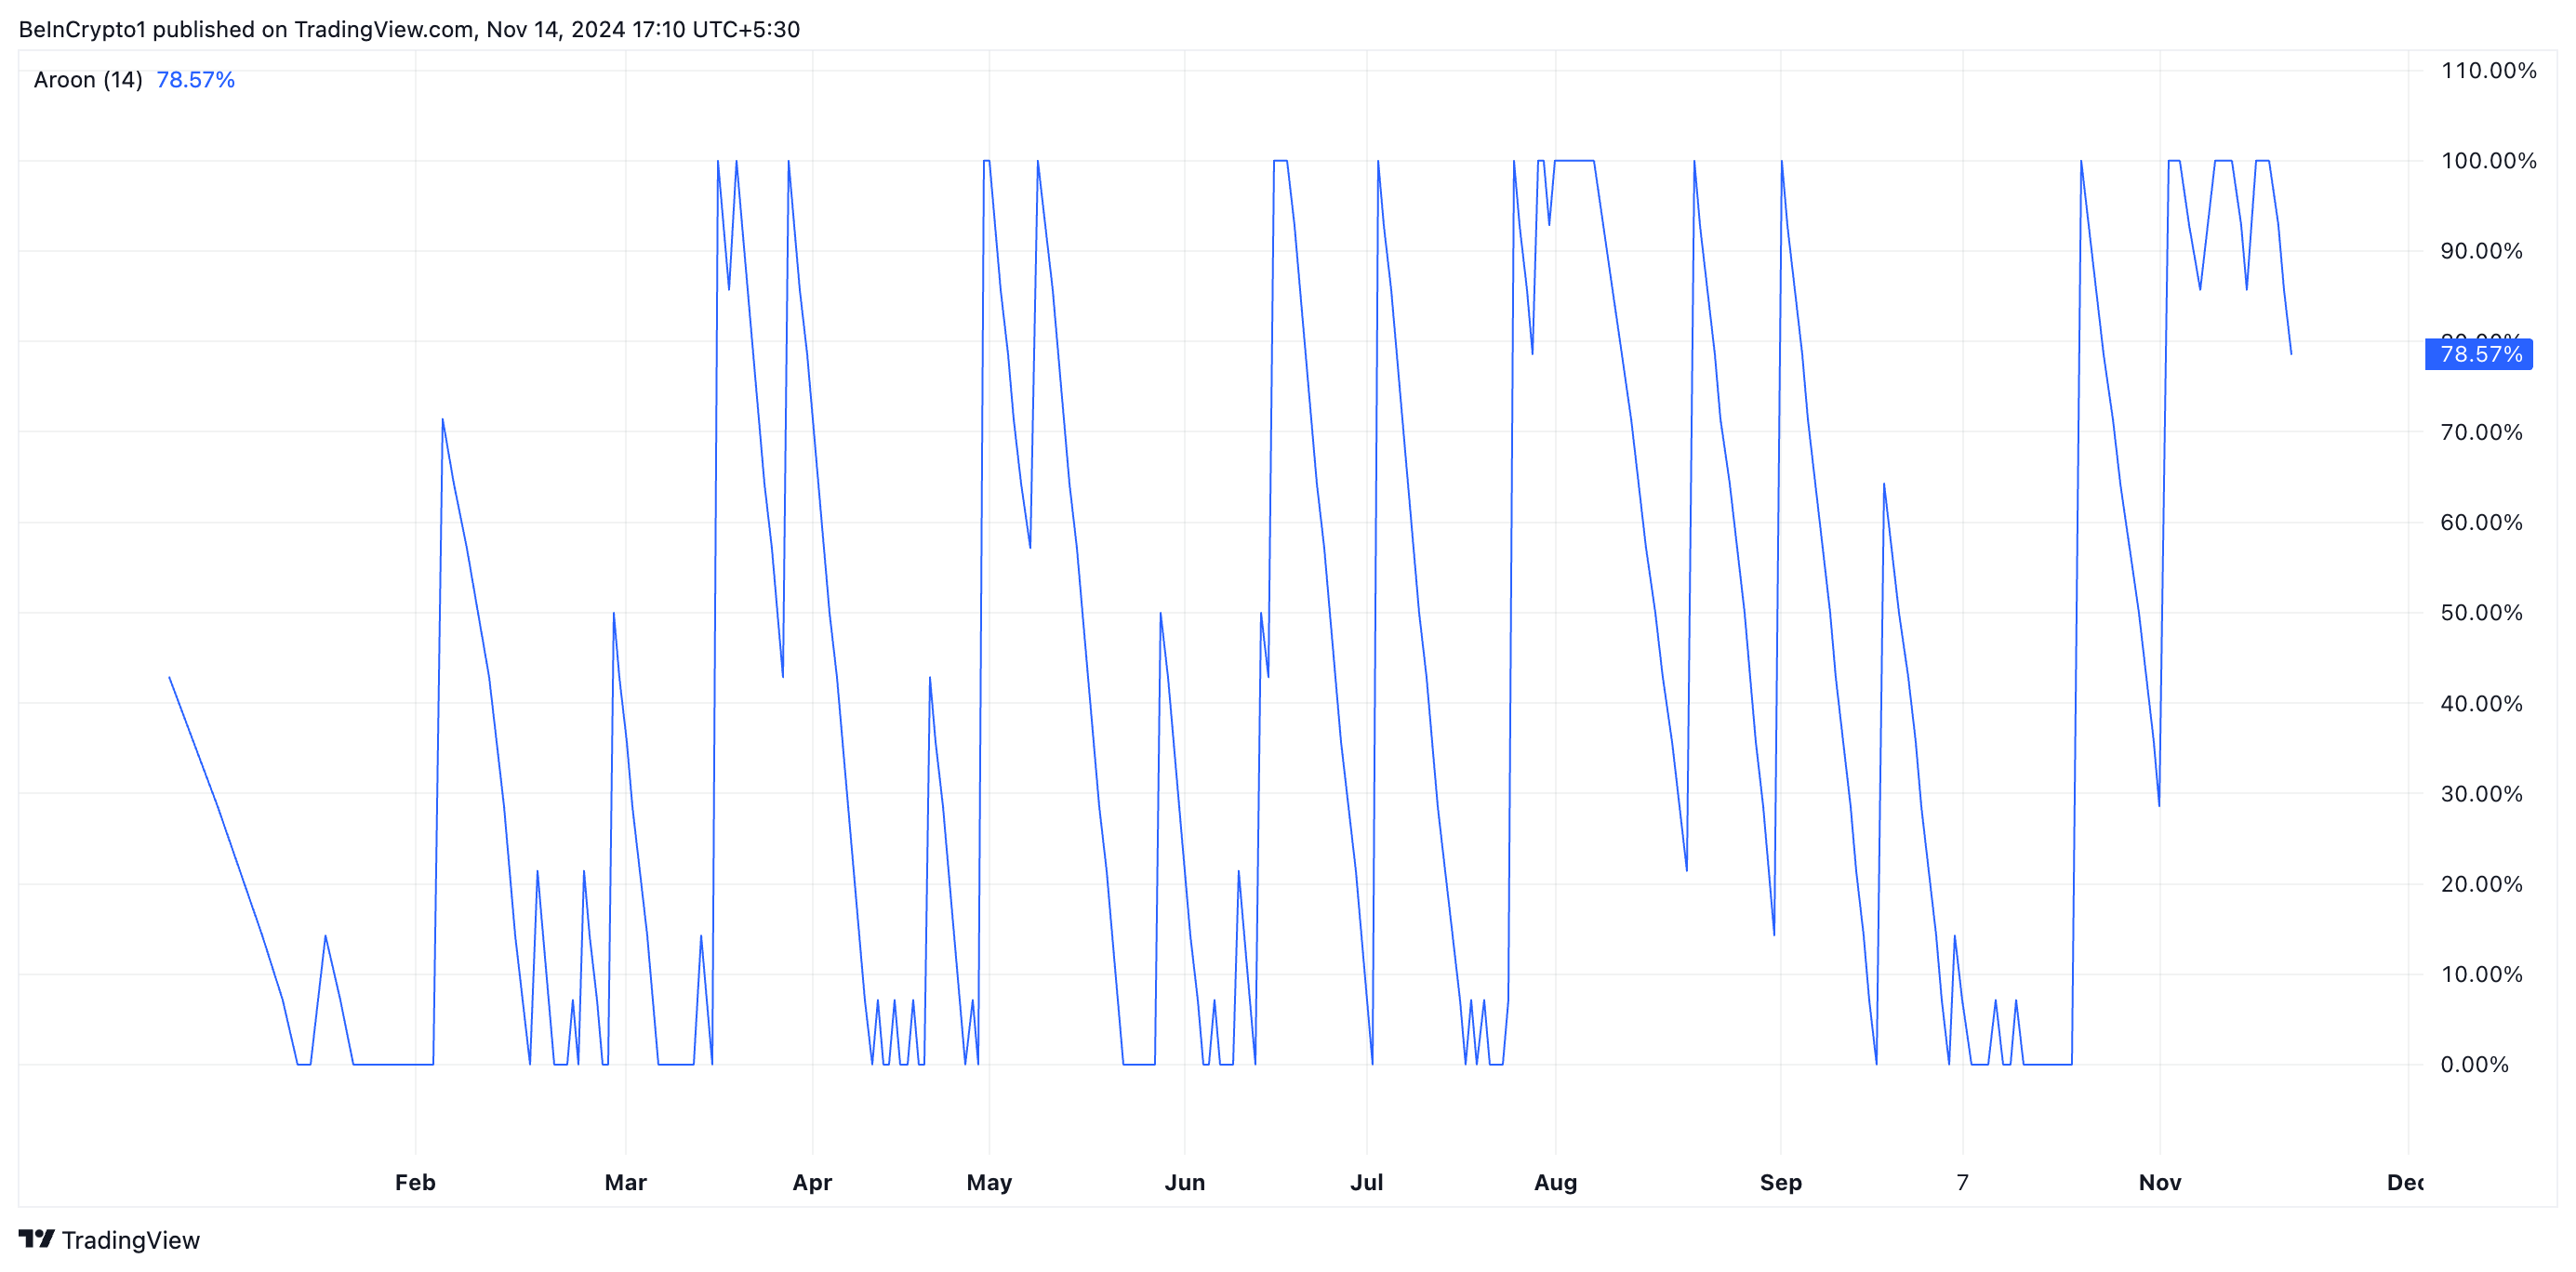
TRUMP’s Aroon Down Line confirms the strength of its current downward trend. The indicator’s value is close to 100 at 78.57 at press time.

TRUMP Aroon Down Line. Source: TradingView
The Aroon indicator identifies the strength and direction of a trend. When the Aroon Down Line is close to 100, the asset’s price has consistently made recent lows over the measured period. It suggests the asset has been in a strong downtrend, indicating sustained bearish momentum.
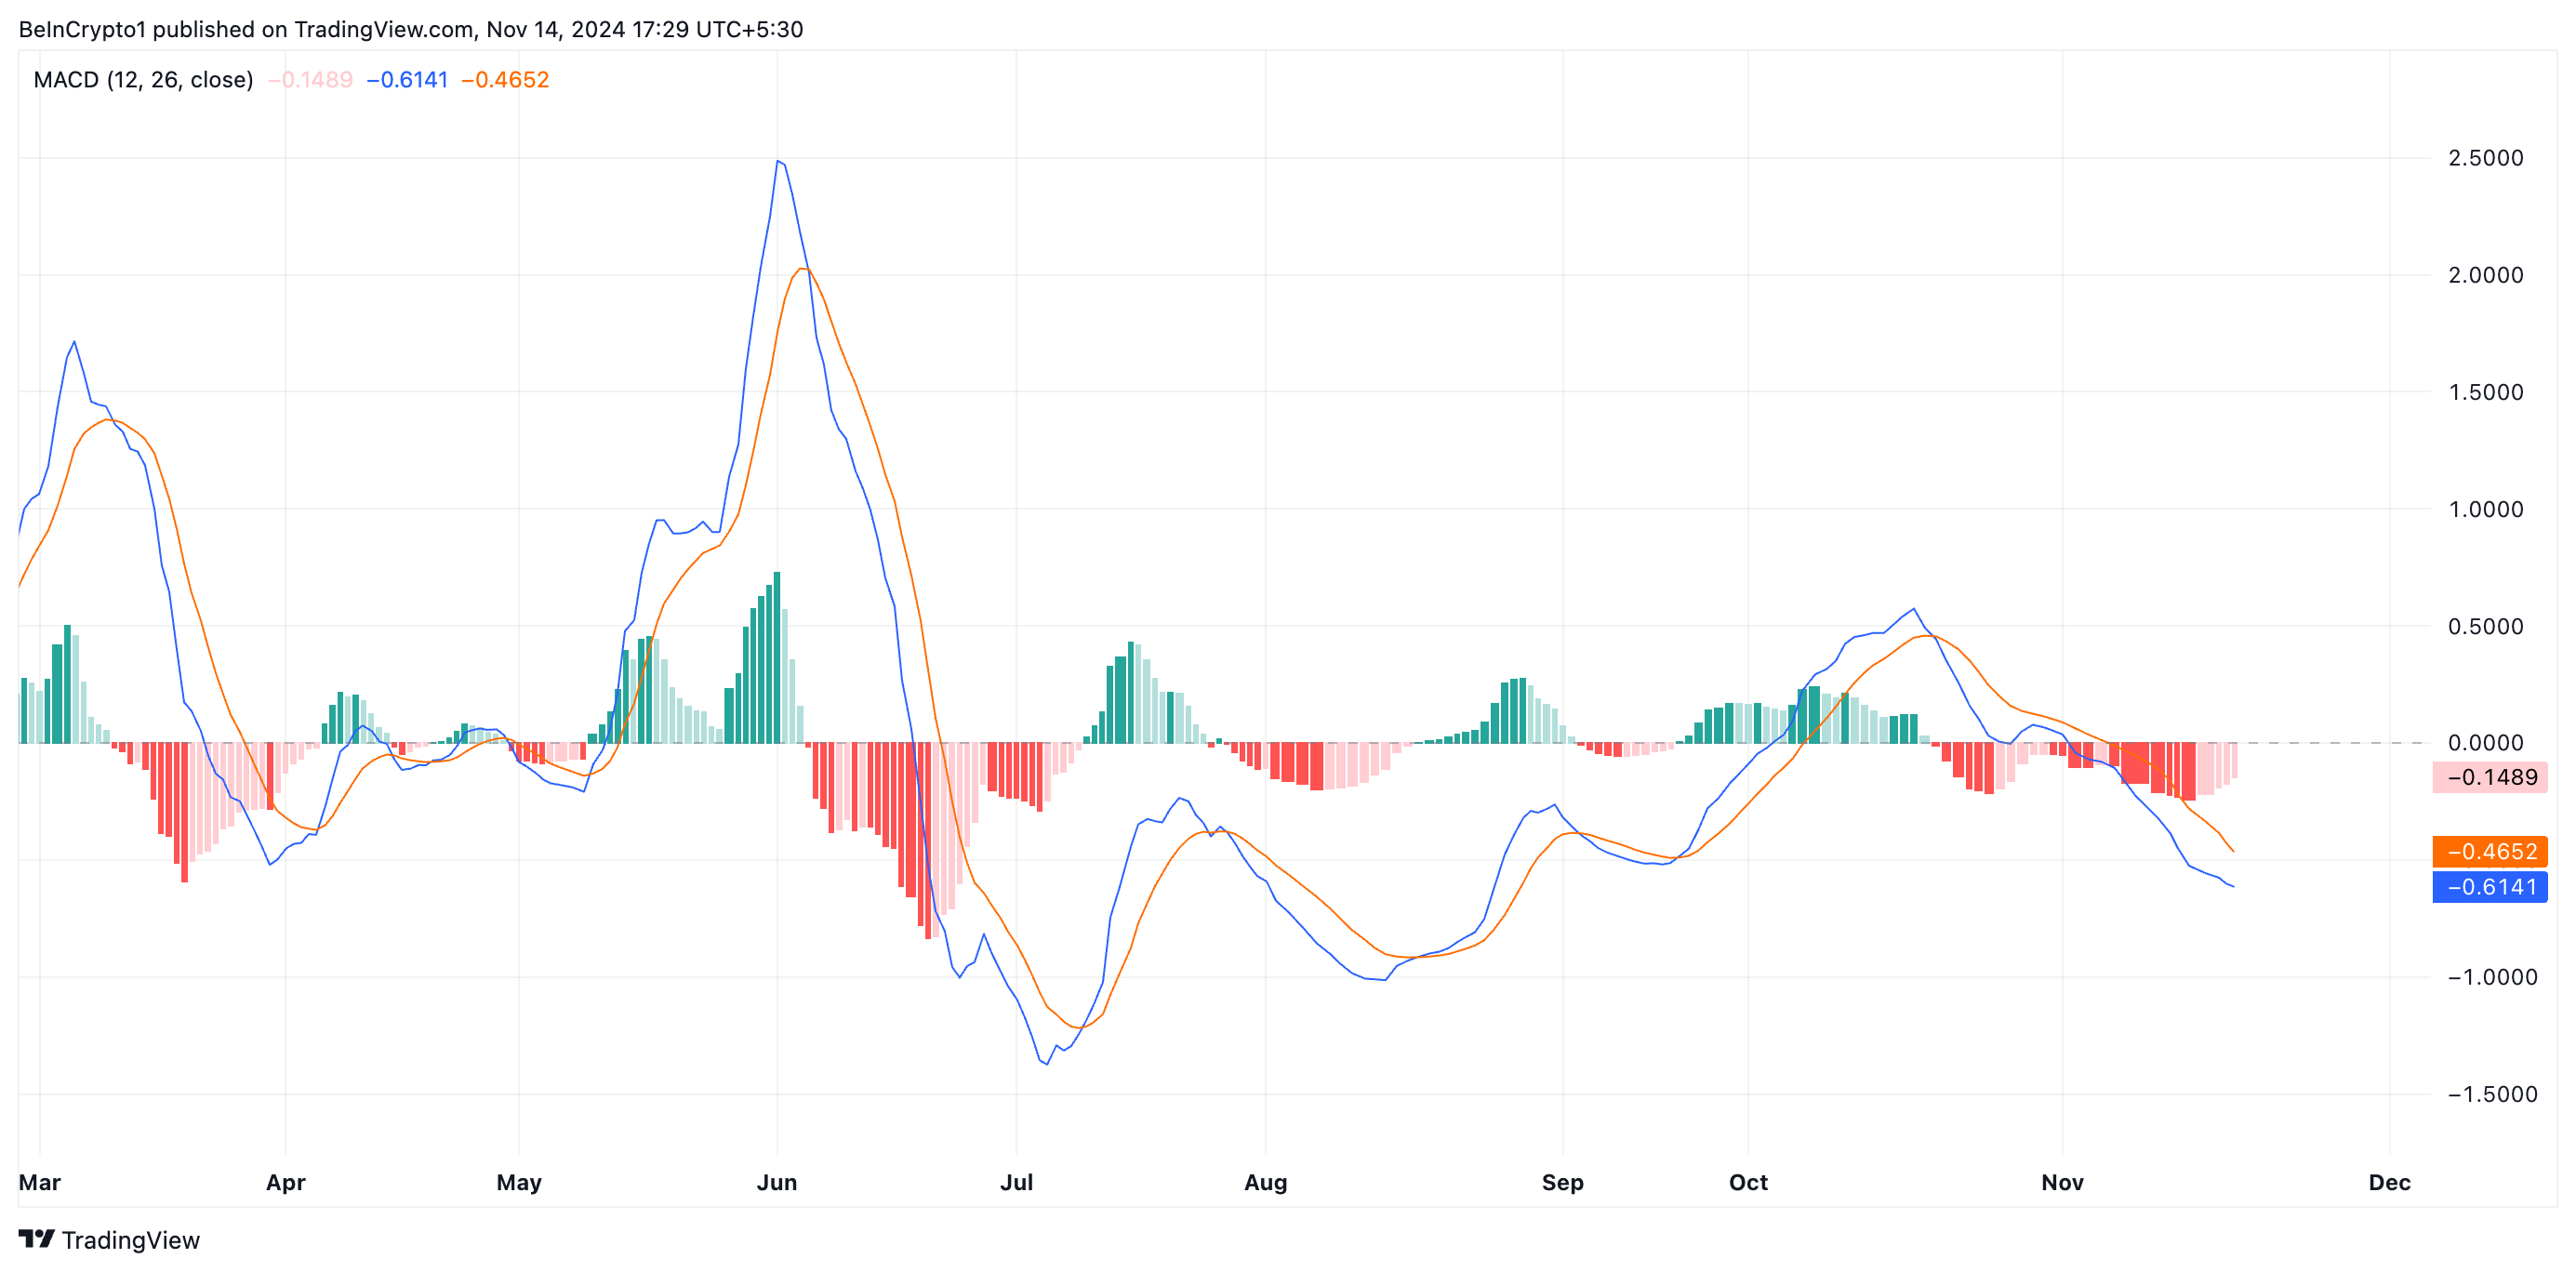
Additionally, the setup of TRUMP’s moving average convergence/divergence (MACD) indicator confirms the rising selling pressure in the market. As of this writing, the meme coin’s MACD line (blue) rests below its signal line (orange) and is under its zero line.

TRUMP MACD. Source: TradingView
This indicator tracks an asset’s trend direction, shifts, and potential price reversal points. When the MACD line is below both the signal and zero lines, the asset’s short-term momentum is weak, signaling a potential bearish trend. Traders interpret this as a strong selling signal, as it implies that the price is likely to continue declining.
TRUMP Price Prediction: Meme Coin May Be Oversold
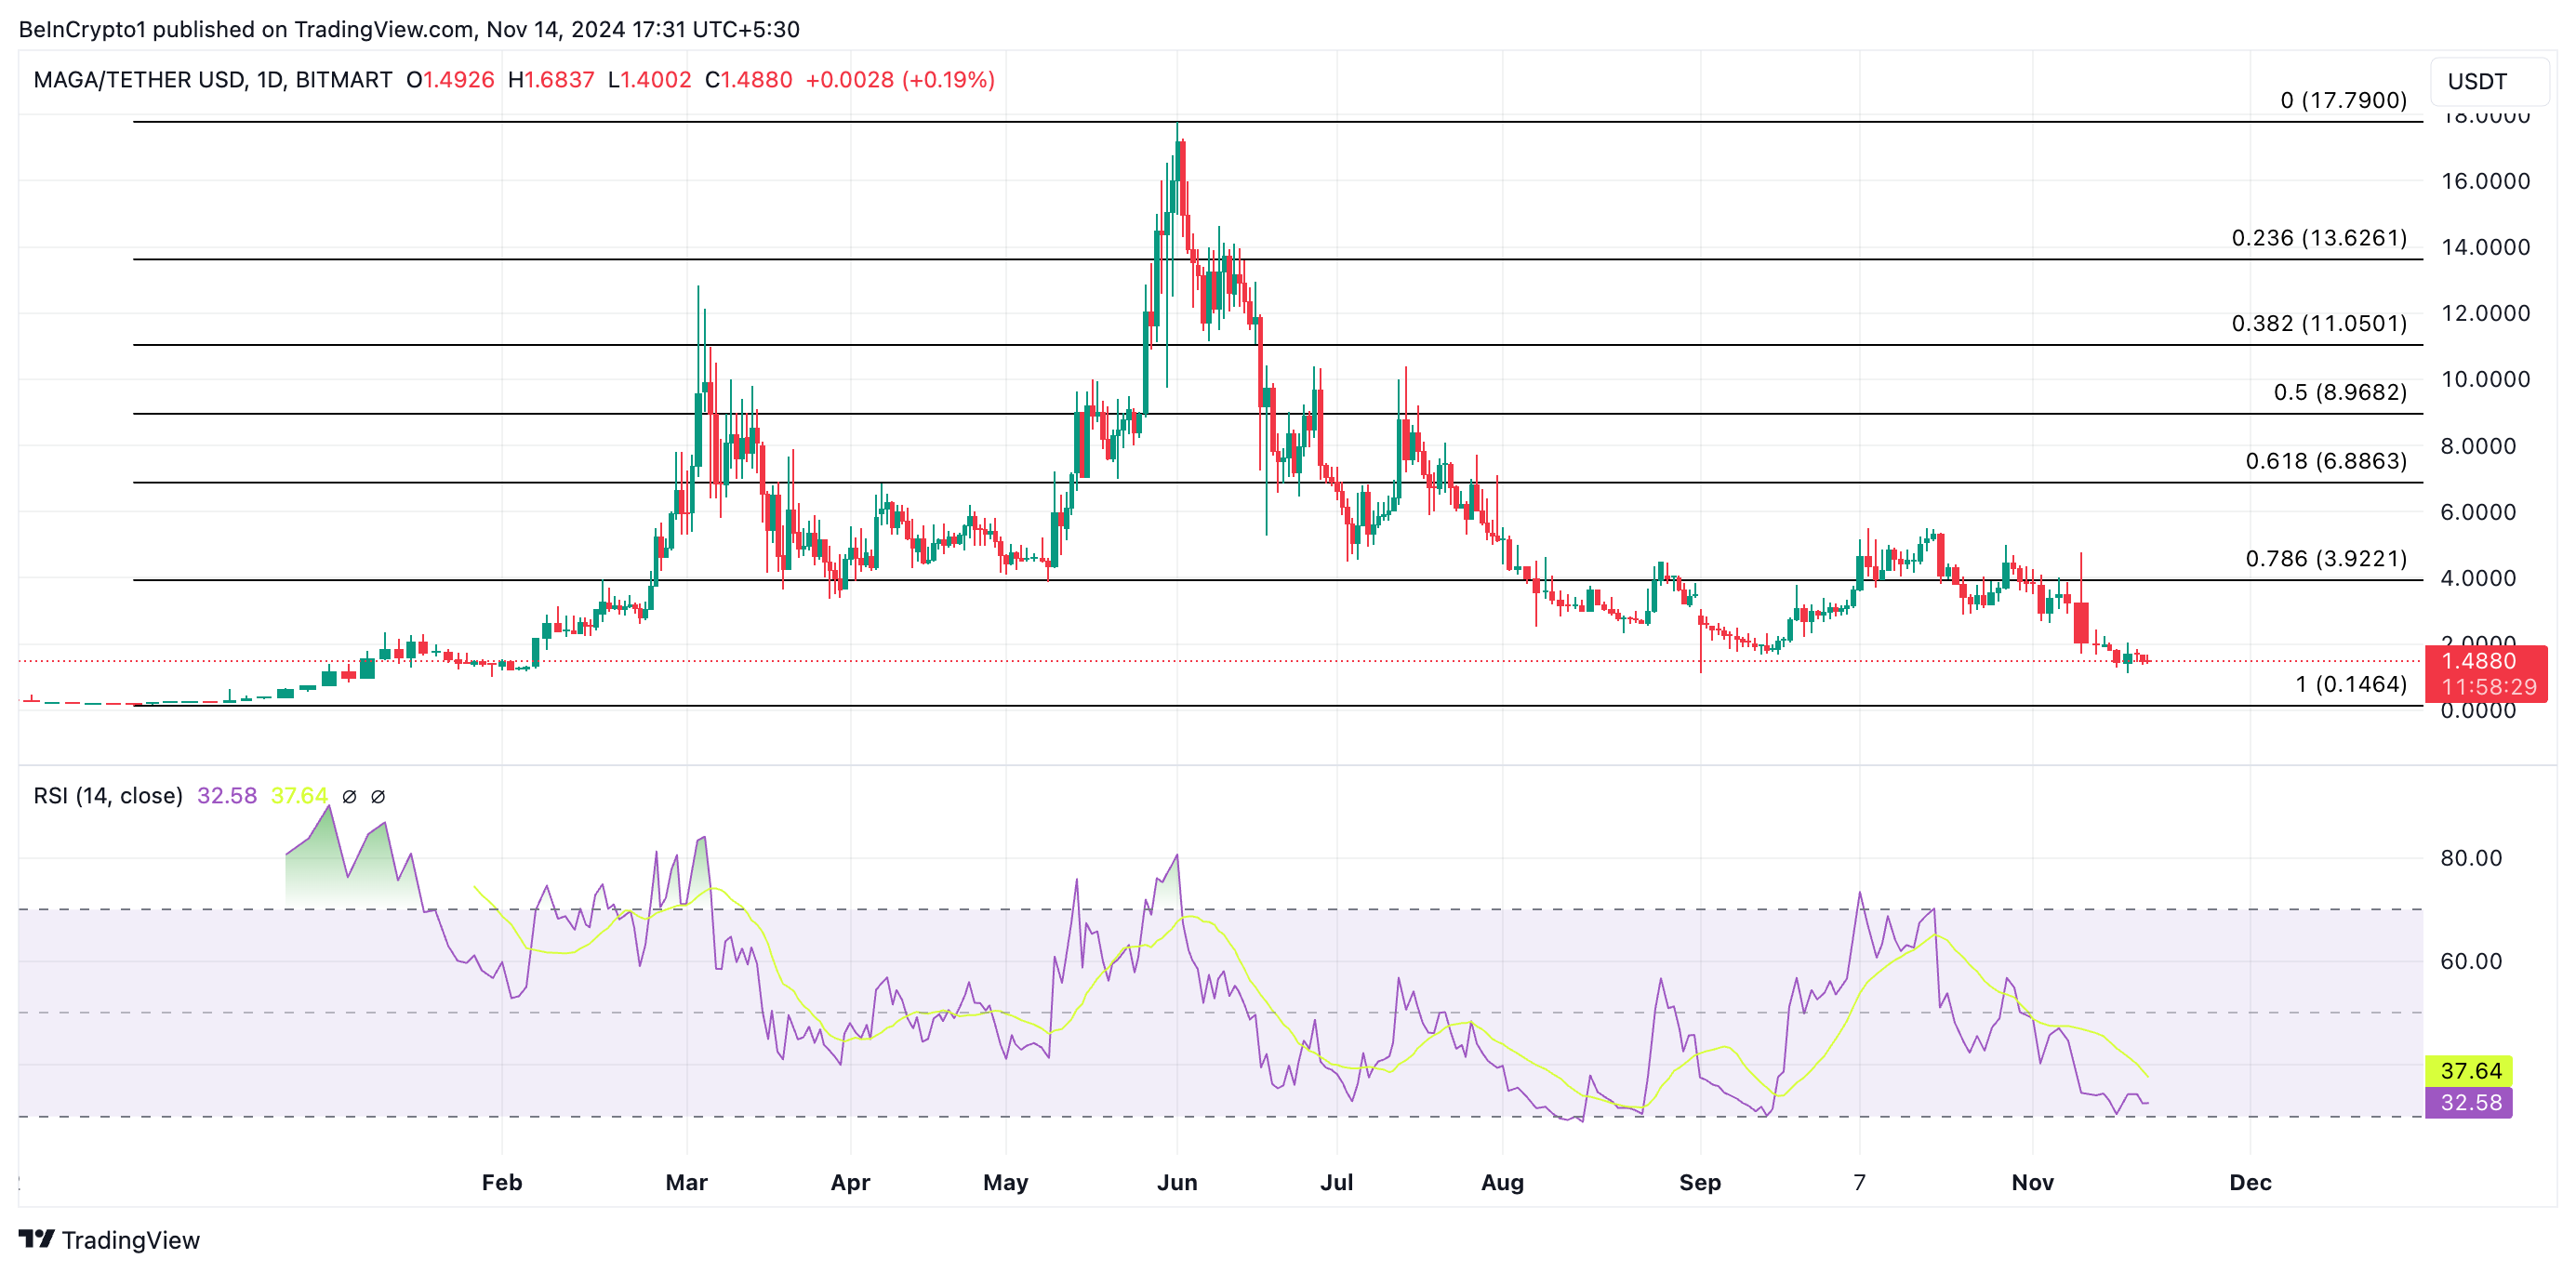
Currently, TRUMP trades at $1.48. If the decline continues, its next price target is its January low of $0.14, which is its year-to-date low.
However, readings from the meme coin’s Relative Strength Index (RSI) suggest that it is almost oversold and due for a price rebound. At press time, TRUMP’s RSI is at 32.58.
The RSI indicator assesses whether an asset is oversold or overbought. Its values range between 0 and 100. Values above 70 indicate that the asset is overbought and due for a correction, while values below 30 suggest that the asset is oversold and may experience a rebound.

TRUMP Price Analysis. Source: TradingView
TRUMP’s RSI of 32.58 indicates that the meme coin is nearing the oversold threshold. Traders may start to watch for signs of a price bounce or trend shift, and if this happens, its price may climb toward $3.92.


